
India is middle income now: Raise the poverty line
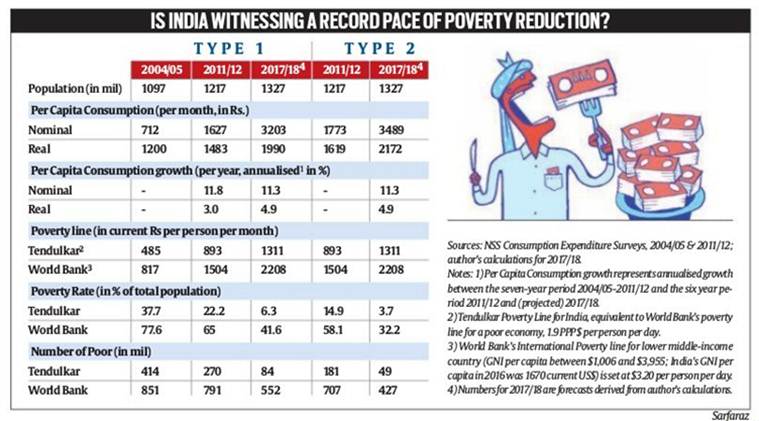
Regardless of the poverty line used, it appears that India is on track for the fastest pace of poverty reduction in the period between 2011/12 and 2017/18
The World Bank is in the business of poverty, and for decades has attempted to objectively define an absolute poverty line. (Illustration by: Sarfaraz)
Today is June 30, a very important day for poverty data junkies. Today is the last day of the NSSO Consumer Expenditure Survey (NSSO-CE) for the period July 2017 to June 2018. The NSSO-CE surveys form the basis of calculations of absolute poverty, an important and political economic variable in India. When the findings of NSSO-CE 2017/18 are released, they will (likely) mark an important departure of India from an absolute poverty obsessed “poor” country, towards a middle-class middle-income economy. It is not clear whether this fact has been absorbed by the Indian public, or Indian politicians. But absorb it they will, especially when the 2017/18 survey indicates that absolute poverty in India, according to the official Tendulkar poverty line, is in the low single digits.
Brookings has just published a blog based on its poverty clock, which suggests that poverty is declining in India at the rate of 44 people per minute. Scholars interested in trends in world poverty must visit http://www.worldpoverty.io/index.html. The Brookings study hints at this transformation; I want to expand on this structural change.
My research with respect to poverty reduction in India suggests that the Brookings study might be overly pessimistic. Their analysis is based on the last NSSO data available 2011/12. If one anticipates (and estimates) the likely findings of NSSO 17/18, the speed of poverty reduction, at present, is more than double that found by Brookings, that is closer to 100 a minute rather than 44 per minute.
Of course, none of us will really know until the NSSO processes the data and releases preliminary findings. When can we expect the results? Normally it is about a year after the last date of the survey, but in 2000, Arun Shourie, then Minister of State for Planning and Programme Implementation, released preliminary results (for July 1999 to December 1999) as early as October 2000. Given the improvements in technology, there really is little reason for the NSSO to delay the release much beyond the time taken by a BJP-led government some 18 years ago.
Before we look at the results (see Table) some bare facts about poverty statistics. If household per capita consumption is below an arbitrary level of consumption, it is classified as poor. While economists have had obtuse debates about the level of this line, it is arbitrary. One such line, adopted by government of India, is the Tendulkar poverty line.
The World Bank is in the business of poverty, and for decades has attempted to objectively define an absolute poverty line. Co-incidentally, its absolute poverty line is always identical to the Indian poverty line. The only difference being that the Indian poverty line is in Rs per capita per month, and the World Bank poverty line is in PPP$ per day. But they are identical in value, as documented in my books The New Wealth of Nations (2017) and Imagine There is No Country (2002).
Recently, the World Bank suggested poverty lines for three classes of countries — the poor (PPS 1.9 per person per day, pppd, 2011 prices), lower middle income (PPP$ 3.2 pppd) and upper middle income (PPP$ 5.5 pppd). India is no longer a poor country though the poverty industry is dependent on this classification for its existence. It’s a lower middle-income country, and should adopt a lower middle income poverty line. This poverty line (PPP$ 3.2) is some 68 per cent higher than the Tendulkar line.
There is considerable reason to think that the 2017/18 poverty results will be an eye-opener. Almost certainly, the poverty rate according to the Tendulkar poverty line — Rs 30 per person per day, pppd, in 2011/12 and estimated as Rs 44 pppd in 2017/18 — will dip to around 4 per cent, or about 50 million poor people. This is too low a poverty line. The World Bank suggests a poverty line of 3.2 PPP$ (2011 prices) which translates into roughly a consumption level of Rs 75 per person per day. In other words, the absolute poor in India today should be defined as those with a consumption level less than Rs 75 per person per day. This means that, at present, a third of the Indian population is absolutely poor. How do we get this estimate, or forecast, of what NSSO 2017/18 data will likely show? By making assumptions about consumption inequality, and growth in per capita consumption.
Inequality: One “surprising” record of consumption inequality in India is that it has stayed roughly constant for the last 30 years. The Gini index — it has a value zero in the utopian economy of all individuals having the same income and value 1 in the world where one person has all the income — of real inequality for consumption in India, in 1983, was 0.3034; in 2011/12, it was 0.3165. If it is assumed that consumption inequality has stayed the same since 2011/12, or has not changed much, then the 2011/12 consumption distribution can be used to assess changes in poverty according to different poverty lines.
Consumption Recall: Estimates of household consumption are based on interviews. For different items, the NSSO interview schedule specifies different “recall” periods. Until 2004/5, there was Type1 recall: Thirty days for fruits and vegetables, and most other items of consumption, and 365 days for major items of consumption. In 2011/12, a new method (Type2) was used where fruits and vegetables (perishables) were based on a recall period of seven days. Just this seemingly minor change led to an increase in average consumption of 6 per cent for the same year, and a change in the Tendulkar poverty estimate from 22.2 per cent to 14.9 per cent for the same year.
Consumption: We estimate average consumption growth since 2011/12 on the basis of growth in personal consumption expenditures in the national accounts (NA) minus the consumption in the NA that does not accrue to households, for example, estimates of consumption of banking services, consumption by NGOs, etc. In addition, the share of consumption (private final consumption expenditures) in NA has increased from 56.2 per cent in 2011/12 to 59.2 per cent in 2017/18. All of this adds up to the fact that real average real consumption over the last six years has grown at an average rate of 4.9 per cent per annum, compared to an average growth rate of 3 per cent in the period 2004/5 to 2011/12.
Poverty: The 2017/18 data (it is believed) will be based on the Type 2 method, and it is expected that the Tendulkar poverty line will yield a low estimate of 4 per cent. According to the 68 per cent higher World Bank middle income (WBMI) line, close to 78 per cent of the Indian population was absolutely poor in 2004/5, a proportion that was brought down to 65 per cent in 2011/12, and 42 per cent in 2017/18. However, for Type2 consumption, WBMI line will likely yield an estimate of absolute poverty around 33 per cent in 2017/18.
The data presented in the table indicates that the (likely) pace of poverty reduction between 2011/12 and 2017/18 was substantially higher than in the earlier 2004/5 to 2011/12 years. The latter period was clearly the UPA period; the six-year 2011 to 2017 period has two UPA years and four NDA years. Inclusive growth, if defined as the pace of poverty reduction, was much better in the NDA years — a decline of 3.9 percentage points a year (Type1 recall, WBMI line) versus less than half that rate, 1.8 pppt a year, under UPA. For the Type 2 recall, the pace of decline may even be faster, at 4.3 pppt a year. In a later study, and especially after the official release of the data, it will be interesting to analyse whether the pace of decline in the last six years has been one of the fastest observed in the world.
We wait in suspense — the NSSO can help out by processing the data as quickly as the precedent set by Arun Shourie.
Bhalla is senior India analyst at Observatory Group, a New York-based macro policy advisory group,part-time member, PM’s Economic Advisory Council. Views are personal
For all the latest Opinion News, download Indian Express App
More From Surjit S Bhalla
- Let the elite payTo reform education system, provide a level playing field, regardless of caste, sex, or income. Stop subsidising higher education for the rich. ..
- Inflation, not yet viralPronouncing the rebirth, or even significant acceleration in inflation, may be a trifle premature..
- Will Karnataka toll for the Congress?The Congress stands to both gain, and lose, more from the Karnataka poll results than the BJP. That is the simple asymmetry behind this important…


.png)


No hay comentarios:
Publicar un comentario