
The writer is chair professor for agriculture at ICRIER. Views are personal

Ranjana Roy is Research Associate at ICRIER
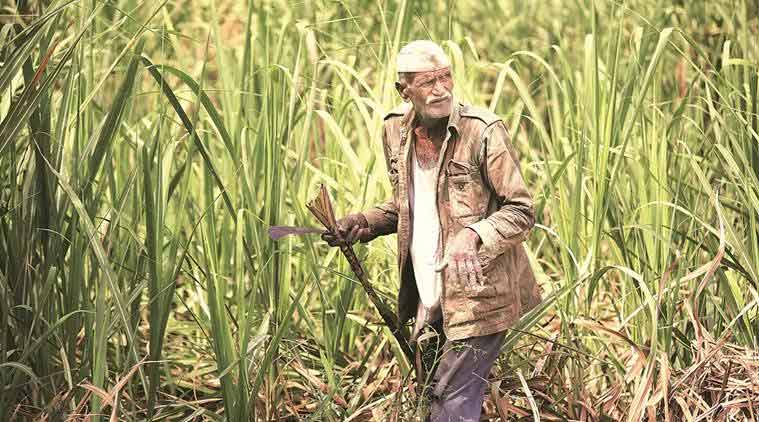
From plate to plough: No achhe din for the farmer
When it comes to agriculture growth, the NDA government compares poorly with its immediate predecessor. The next government must initiate structural reforms, set realistic targets
The Central Statistics Office (CSO) has released the second advanced estimates of national income for 2018-19, along with the quarterly GDP estimates for Quarter 3 (Q3). The overall GDP for Q3 is down to 6.6 per cent and for 2018-19 as a whole, the GDP is expected to grow at 7 per cent, a notch lower than 7.2 per cent achieved in 2017-18.
Our concern, however, is with the performance in agriculture, which engages almost 47 per cent of the country’s workforce. Its growth, therefore, has a significant influence on poverty. The growth of Gross Value Added (GVA) at basic prices from the “agriculture, forestry and fishing” sector is expected to be 2.7 per cent in 2018-19 — as against 5 per cent in 2017-18. This is a massive drop of 46 per cent. The CSO clearly states that the GVA for this sector has been compiled using the Second Advanced Estimates of Production of Crops for 2018-19. However, in case of the livestock sector, the estimates are taken from production targets for milk, eggs, meat and wool. Generally, targets are most optimistic than what turns out to be the reality.
It is normally agreed that the year-on-year growth rates of agriculture fluctuate much more than the overall GDP growth rates, as almost 52 per cent of the country’s cropped area is still dependent on the monsoon. A year-on-year comparison can be misleading. So, we look at the five-yearly performance in agriculture under the Narendra Modi government and compare it with earlier regimes — beginning with the Narasimha Rao government which ushered in economic reforms in 1991. We avoid the period between 1996 and 1998, when three prime ministers held office — Atal Bihari Vajpayee (first time), H D Deve Gowda and I K Gujral. But we take 1998-2003-04 (the NDA government under Atal Bihari Vajpayee), 2004-05 to 2008-09 (UPA-1), 2009-10 to 2013-14 (UPA-2) and 2014-15 to 2018-19 (the Modi government). Graph-1 shows the average annual growth rates of agriculture GDP (GVA at basic prices for later years), as given by the CSO.
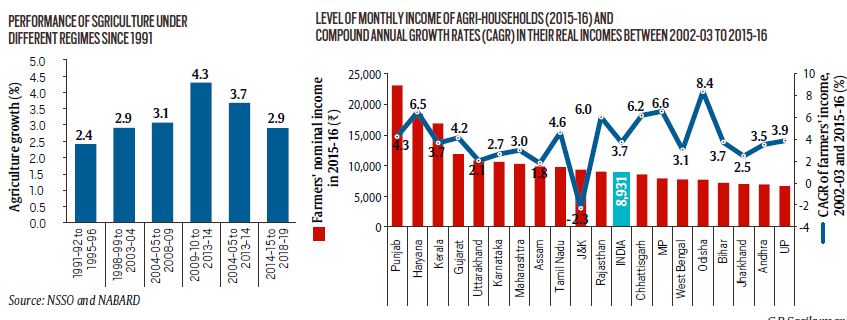
The graph shows that the Modi government’s record in agriculture is mediocre: At 2.9 per cent, it is better than the 2.4 per cent achieved by the Narasimha Rao government, equals the performance of the Vajpayee government, is a notch below the 3.1 per cent achieved by UPA-1 but significantly lower than the 4.3 per cent growth rate achieved by UPA-2. Evaluating these growth rates over a longer period is important because the real incomes of agri-households move in tandem with the overall agri-GDP growth. It is also important to take note of these figures in light of the Modi government’s much talked-about target of doubling farmers’ incomes by 2022-23.
Graph-2 presents the monthly incomes of agri-households in major states of India, and for all India, as estimated in the NABARD’s latest survey on Financial Inclusion, often called NAFIS, for the agricultural year, 2015-16. Agri-households in Punjab had the highest monthly income of Rs 23,133 while Uttar Pradesh with Rs 6,668 occupied the lowest position. At the all-India level, the average income of an agri-household in 2015-16 turned out to be just Rs 8,931 per month.
The compound annual growth rates (CAGR) of real incomes between 2002-03 (NSSO survey) and 2015-16 (NABARD survey) (the RHS axis) comes to 3.7 per cent at the all India level, with a high of 8.4 per cent for Odisha (though with a low base) and minus (-) 2.3 per cent for agri-households in Jammu and Kashmir. It may be noted that the CAGR are impacted by the performance in agriculture in the base or terminal year. It is interesting to see that the CAGR of agri-GDP for the period 2002-03 to 2015-16 is 3.8 per cent while the CAGR of agri-household incomes is 3.7 per cent.


.png)


No hay comentarios:
Publicar un comentario