
Jobs and the pre-election year
Conventional wisdom of no job growth in 2017-18 is found to be a gross under-estimate by a correct application and interpretation of household survey data for that period.
The CMIE total employment estimate for 2017-18 is 406.2 million. (Illustration: CR Sasikumar)
The job controversy goes on. The last official (conducted by a government organisation) employment survey was undertaken in 2015. Since January 2016, a private organisation (Centre for Monitoring Economy, CMIE) in collaboration with the Bombay Stock Exchange has been publishing tri-annual estimates of employment and unemployment for the labour force (individuals of 15 years and above).
So far, nothing controversial. What brings spice to the estimates is that this is an election year, and in an eerie but not surprising replay of 2013, Opposition politicians are making the assertion that unemployment is very high (and much higher than the official estimates for 2013), jobs are scarce, and workers, especially women workers, are withdrawing from the labour market at an unprecedented rate not only for India, but for the world. This rate of withdrawal for women (rate of change in what economists call the labour force participation rate, LFPR) is higher than that observed for any country in the world, and at any time in recorded history.
The 2016-onwards LFPR (and associated employment) data are from CMIE. Tirtha Das and I (hereafter Bhalla-Das) wrote a draft report in July 2018, “All you wanted to know about jobs in India — but were afraid to ask”. The problem we encountered in making an estimate for the employment year 2017-18 (July 2017 to June 2018) was that the CMIE data used a definition of employment heretofore not used by any previous household survey in India.
CMIE’s definition of employment in the Consumer Pyramids Household Survey (CPHS) is as follows. “Any person who is engaged in any economic activity either on the day of the survey or on the day preceding the survey or is generally regularly engaged in an economic activity but did not work on any of these days only temporarily.” The employment surveys conducted by government authorities have one of three (or all three) definitions: Current daily status (an aggregated average of work on the previous seven days, with work in each day classified as 0, half day or full day), a weekly definition (did you work one hour in the preceding week), or usual principal status (comparable, but not identical, to the generally engaged in household activity and equivalent to working on the job for at least a half year).
Fortunately, Mahesh Vyas, CEO of CMIE, has, clarified in an article (“The bitter truth of female labour participation”, Business Standard, October 9) that “the appropriate indicator to compare CMIE’s CPHS estimates of labour participation and employment with the NSSO’s estimates is the NSSO’s Current Daily Status (CDS) estimates”. This clarification is immensely useful, and allows us to directly compare NSSO data with the CPHS data (and will form part of the forthcoming revision of the Bhalla-Das paper). Vyas goes on to claim that the Bhalla-Das estimate of 12.8 million jobs in 2017 is therefore completely wrong. Bhalla and Das are also wrong in assuming arbitrarily that the CPHS female labour participation (FLFPR) is unacceptably low”. (emphasis mine).
As an economist, I learnt very early that to state somebody is wrong, let alone completely wrong, was not advisable. What if somebody is partially right? In economics, everything is debated, and we Indians even debate whether the force of gravity is 32.0 ft/sec2 or 31.999. As I document below, Vyas may be in error in interpreting trends in FLFPR. This trend interpretation is the key to the CMIE estimates of labour force and the all-important estimate of employment in India in pre-election year 2018.
Vyas provides evidence to buttress his claim that the decline in rural female LFPR is very noticeable in the NSSO CDS estimate — from 19.7 per cent in 2009-10 to 18 per cent in 2011-12, a drop of 85 bp a year. The CMIE FLPR for 2016 is 15.8 per cent, or a “trend” decline of 56 bp a year. Given that the trend decline of FLFPR is lower, under Vyas’s estimation, than the NSS trend, Vyas concludes that “there can be no complaint against CMIE” for its estimates of female LFPR.
Analysis of unit-level NSSO data (rather than the published NSSO reports used by Vyas) reveals that Vyas is completely correct in his estimates of rural female LFPR decline. However, the NSSO LFPR cited by Vyas is for the entire population (all ages) whereas the CMIE LFPR is for ages 15 years and above!
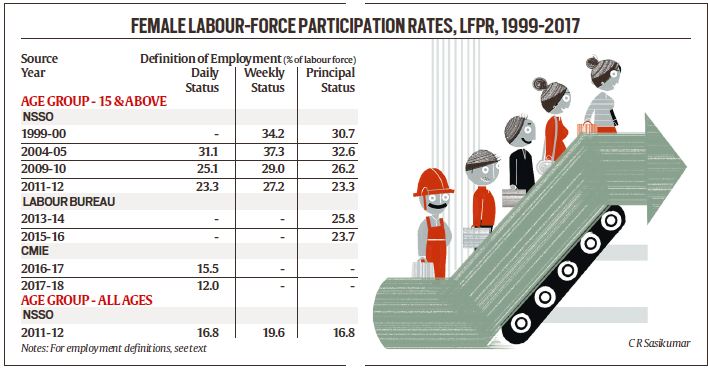
Unit-level data does allow one to estimate LFPRs for the CMIE (and ILO and World Bank) definition of labour force. In 2011-12, the CDS estimate of LFPR is a low 16.8 per cent for all ages, not much different than the 15.5 per cent CMIE estimate for those above 15 years of age. The corresponding CDS estimate for 2011/12 is 23.3 per cent, that is if the same >=15 age-group is taken, then the NSSO estimate of FLPR of 23.3 per cent is 780 bp above the CMIE estimate for 2016!
I report all the data in the table so the reader can rightly pick and choose and compare the different estimates of FLFPR. And be as “selective” as possible — the reality of large gain in 2017-18 (over 2011-12), according to CMIE, is ever present. Opposition economists will now have to use a different CMIE stick to make the claim that jobs were lost in 2017-18.
There are some sobering facts about female labour force participation and total employment.
First, the daily status estimates of LFPR are the lowest among the three estimates (daily, weekly and principal status) available. The most popular estimate of employment (worldwide) is the weekly definition, and weekly estimates are the highest in every year — in 2011-12, this estimate, at 27.2 per cent, is nearly 400 bp higher than the daily estimate of 23.3 per cent.
Second, for the only definition (principal status) for which LFPR rates are available post 2011-12 (the Labour Bureau surveys for 2014 and 2015), FLFPR increased in 2014 by 250 bp over the 2011-12 estimate, and increased by 40 bp in the second successive drought year of 2015-16.
Third, if trends are to be used for estimating the NSSO equivalents for 2016 and 2017, then such LFPRs have to be higher, not lower, than the 2011-12 estimate. If the CMIE estimate of 12 per cent in 2017-18 is made just equal to (not more than) the NSSO estimate of 23.3 per cent in 2011-12, then the estimate for female employment in 2017-18 is nearly double the CMIE reported estimate of 49 million employment. More accurately, a 23.3 per cent FLFPR in 2017-18 will yield a female employment level of 95 million; CDS employment for females was 82 million in 2011-12.
Fourth, we report on the gains (or losses) in total employment in 2011-12 and 2017. In his “Employment — The Big Picture” presentation at the IC Centre for Governance on October 1, Vyas estimates NSSO daily employment to be 381.9 million in 2011-12. The CMIE total employment estimate for 2017-18 is 406.2 million. According to Vyas, the two are very comparable. This means there was a 24 million job increase between 2011-12 and 2017-18.
Since the only household survey that exists post 2015 is the CMIE survey for 2016, 2017, and 2018, the debate about job gain has to centre on the CMIE estimate — at least until the NSSO data for 2017-18 are released. The CMIE data are problematic (we believe) for the primary and major reason of only a 12 per cent female LFPR in 2017/18. Vyas, the author of the CMIE data, claims his data are valid because these data accurately reflect the NSSO levels, and trends, in FLFPR. But this conclusion is based on a false comparison of FLFPR for all ages with a FLFPR for ages 15 and above. Correction for this error, and even assuming a trend decline in LFPR when the trend is likely to be mildly positive, will easily add at least 30 million to total number of jobs to the CMIE estimate of 405 million jobs in 2017-18.
he writer is contributing editor, Indian Express and part-time member of the Prime Minister’s Economic Advisory Council. Views are personal
For all the latest Opinion News, download Indian Express App
More From Surjit S Bhalla
- Scalding oil, sliding rupeeSometimes a crisis is brought on by faulty analysis; at others, by poor politics. The proper response to a crisis, however caused, is to change…
- Pro-women, pro-poorIndia may have just witnessed the best four years of inclusive growth, thanks to the Centre’s sanitation programme..
- Not a question of cashWhether demonetisation failed or succeeded is not a moral question. Is it too much to expect that in this data-dependent world, we should discuss hard…


.png)


No hay comentarios:
Publicar un comentario