
Unemployment, really
Surjit Bhalla contested CMIE’s labour growth estimates by suggesting it had got the female labour participation rates wrong. CMIE explains why it is right and how demonetisation cost jobs
Survey says that the female labour participation rate fell further at the rate of 1.39 percentage points per year between 2011-12 (NSSO) and mid-2016. (Illustration by C R Sasikumar)
First, I thank Surjit Bhalla for pointing an error in my comparison of CMIE’s Consumer Pyramids Household Survey (CPHS) estimates of labour market statistics with those from the National Sample Survey Organisation (NSSO) surveys. However, even after using the data he presents, it is easy to see that the fall in female labour participation rate seen in the CPHS data is broadly in line with the trends seen in NSSO data. Besides, a crucial comparison made by him to magically double the number of women employed is not kosher. We discuss this later below.
CPHS estimates are based on the status of respondents on the day of the survey. This ensures almost no recall problem. The unambiguous nature of a daily recall and the power of fast frequency surveys make CPHS an exceptionally powerful survey. It makes it possible for us to conduct natural experiments as we could in the case of demonetisation. NSSO surveys do not have a comparable measure of daily status. And, their surveys are not fast-frequency. Their measures are of principal and secondary activities based on the status over a 365- day period and a 7-day period. Their results are of annual observations.
We, therefore, do not generally try and make comparisons between NSSO and CPHS. But, comparisons are sometimes necessary and also useful. Here are some comparisons.
Consider the following: CPHS has a sample size of 1,78,000 households in comparison to NSSO’s 1,20,000. CPHS is necessarily conducted using hand-held GPS-enabled devices while NSSO surveys are done using paper with no tracking devices. CPHS data is validated 100 per cent in real-time by supervisors while the survey is being executed. NSSO validations are offline and mostly post-hoc. CPHS results are released within a few hours of the completion of the survey, while NSSO survey results are released after 6-8 months of the completion of the survey. All the record-level data and the source-code to derive the estimates is available for anyone to check the estimates.
Given the much greater superiority of the CPHS machinery compared to the NSSO as described above, if there is any difference between CPHS and NSSO estimates, the benefit of doubt, if any, should go to CPHS and not NSSO. Nevertheless, one must not expect too much of a difference between the broad all-India level estimates of large surveys, and both the NSSO and CPHS are easily large surveys.
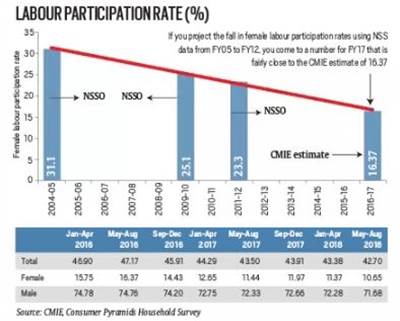
So, what does the NSSO survey tell us about female labour participation rate if we use Bhalla’s estimates (IE, ‘Jobs and the pre-election year’, October 11)? He says if we use the current daily status estimates, female labour participation rate fell from 31.1 per cent in 2004-05 to 25.1 per cent in 2009-10 and further to 23.3 per cent in 2011-12. So, it fell 7.8 percentage points in seven years. This translates into a fall at the rate of 1.11 percentage points a year.
CMIE’s CPHS says that the female labour participation rate fell further at the rate of 1.39 percentage points per year between 2011-12 (NSSO) and mid-2016. Mid 2016 is the period (May-August 2016) when CMIE completed its last survey just before demonetisation. Demonetisation is a game-changer and therefore, we must distinguish the period before and after this huge economic shock. The female labour participation rate fell from 23.3 per cent in 2011-12 (as per NSSO) to 16.37 during May-August 2016 (as per CPHS).
The direction of change is the same as shown by Bhalla using the NSSO’s survey, but the rate of fall increased. But, the greater rate of fall is only expected since the economy slowed down in the latter period. We know that the period of 2011-12 through 2016-17 was one of a slower growth of less than 7 per cent per annum compared to the preceding seven years when the economy grew at more than 8 per cent per annum. Thus, an increase in the rate of fall of labour participation — particularly the female labour participation rate — is not unexpected.
So, CPHS estimates of female labour participation rates are comparable with the NSSO data as churned out by Bhalla. While I stand corrected on the use of the specific indicator, using the data suggested by Bhalla does not change the fact that two large surveys of NSSO and CMIE give estimates of female labour participation rates which are broadly comparable. Ergo, we must accept that female labour participation continued to fall post 2011-12. Note that the increase in the rate at which the female labour participation rate fell between 2011-12 and 2016-17 is not dramatic. A rate of fall of 1.11 per cent points per annum rose to 1.39 per cent points per annum.
The dramatic fall comes after 2016, that is after demonetisation. This is when the female labour participation rate fell by a massive 4.93 percentage points in just one year. It fell from 16.37 per cent in the Wave (as one round of a panel survey is called) of May-August 2016 to 11.44 per cent in the Wave of May-August 2017. Male labour force participation rate fell by a lower 2.5 percentage points, from 74.76 per cent to 72.33 per cent during the same period.
Given that CPHS female labour participation rates are broadly comparable with Bhalla’s estimates derived from unit level NSSO data till mid 2016, then he must accept the steep fall after the May-August 2016 Wave. This is because CPHS is a longitudinal panel survey. It repeatedly surveys the same households with the same questions. It also uses the same weights and estimation procedures.
It does not help if we try hard to not recognise the problem. No country has given itself a shock of demonetisation like we gave ourselves and so it is not surprising that no country ever observed the kind of withdrawal of labour from labour markets like we observed after demonetisation. Given this huge shock of demonetisation, and its evident impact on the labour markets, it is not correct to assume that the labour participation rate has remained unchanged since 2011-12. But, without any explanation, Bhalla makes this assumption and once again magically (or, simply) doubles the number of women employed!
And, he does this by selecting convenient ratios. He states “FLFPR increased in 2014 by 250 bp over the 2011-12 estimate, and it increased by 40 bp in the second successive drought year of 2015-16”. But, he comes to this conclusion by using Labour Bureau estimates for 2013-14 and 2014-15 and NSSO estimate for 2011-12. Instead, if he had used Labour Bureau estimates for all the years under comparison (25.4 per cent in 2011-12 and 23.7 per cent in 2015-16,) he would not see an increase but, he would see a fall. And, then his doubling of women workforce would vanish!
This is not about politics. It is not about elections. The stories and accompanying pictures in The Big Picture feature of Sunday Express (‘World’s largest recruitment drive’, October 7) were not of a political rally. 2.37 crore applicants were trying their luck for 2 lakh jobs in the Indian Railways. Many had started losing hope merely by seeing the level of competition for jobs. Many leave the labour markets when they lose hope.
I believe that a much bigger problem of unemployment will be inherited by the new government.
The writer is managing director and CEO, Centre for Monitoring Indian Economy P Ltd. (CMIE)
For all the latest Opinion News, download Indian Express App
More From Mahesh Vyas

- The myth of 15 million jobsIncomparable data sets, cherry-picking, and dubious statistical analysis are behind the claims of robust employment growth. Only 1.4 million jobs were added in 2017...
- Union Budget 2018, Guest Column: Whither employment?If we are generating 7 million formal jobs in a year then surely there should not be any employment problem. If this is so, then…
- Where have all the investments gone?The average value of new investments in the past three quarters is nearly half the average in the preceding three quarters...


.png)


No hay comentarios:
Publicar un comentario