Poverty in all its faces
Growth can alleviate poverty but its definition needs to expand to make any tangible difference on the ground.

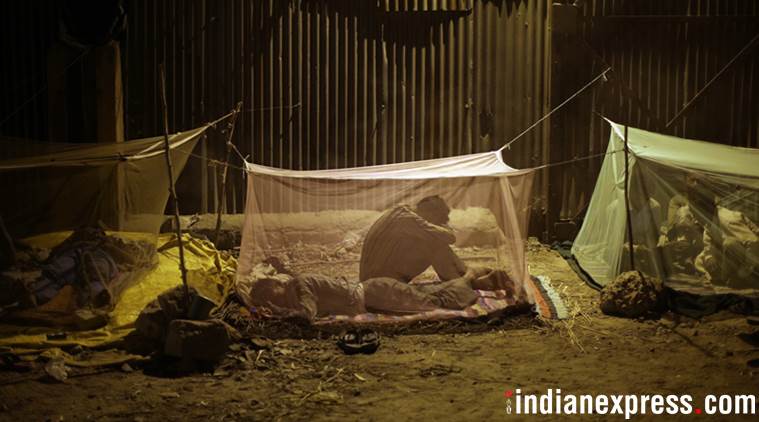
It is important to note that measuring reduction in poverty ratio is not the same as measuring inequality. (File Photo)
Amidst the din caused by the story of rising billionaires, the message on India’s poverty decline in the recent report of the Oxford Poverty and Human Development Initiative has been lost. UNDP and Oxford University released the report on Global Multidimensional Poverty Index (MPI) 2018. This report covers 105 countries. The MPI is based on 10 indicators: Health, child mortality, years of schooling, school attendance, cooking fuel, sanitation, drinking water, electricity, housing and assets. This report has specifically discussed the case of India. It is well worth quoting the opening paragraph on India: “India has made momentous progress in reducing multidimensional poverty. The incidence of multidimensional poverty was almost halved between 2005/6 and 2015/16, climbing down to 27.5 per cent. The global Multidimensional Poverty Index (MPI) was cut by half due to deeper progress among the poorest. Thus within ten years, the number of poor people in India fell by more than 271 million — a truly massive gain”. This is indeed high praise. The report also says that the poorest groups had the biggest reduction in MPI during the period 2005/6 to 2015/16, indicating they have been “catching up”.
Is the conclusion of global MPI a new revelation? No. The estimates of poverty-based on consumer expenditure and using the Tendulkar committee methodology show over a seven-year period between 2004-05 and 2011-12, the number of poor came down by 137 million despite an increase in population. According to the Rangarajan Committee methodology, the decline between 2009-10 and 2011-12 is 92 million, which is 46 million per annum. For a decade, it will be larger than that of global MPI.
The poverty ratios based on Tendulkar and Rangarajan Committee methodologies are lower than as estimated by global MPI. We have reservations on using multiple indicators as these multidimensional indicators/measures raise several issues regarding their measurability, aggregation across indicators, and, crucially, of databases that provide the requisite information at reasonably short intervals. These need to be considered and evaluated carefully. Aggregation is another problem. In principle, they should be independent. Access to safe drinking water, for example, cannot be aggregated with indicators like child mortality. Even in respect of independent indicators, analytically appropriate rules of aggregation require that all of them relate to the same household. More generally, this requirement poses several data constraints.
It may be noted that we are not against multidimensional poverty or deprivations. One can analyse the progress of non-income indicators like education, health, sanitation, drinking water, child mortality etc. over time with income or consumption poverty. But, converting all of them into an index poses several problems. Deaton and Dreze (2014) also indicate that “it is important to supplement expenditure-based poverty estimates with other indicators of living standards, relating for instance to nutrition, health, education and the quality of the environment”.
In the minds of most people, being rich or poor is associated with levels of income. The various non-income indicators of poverty are, in fact, reflections of inadequate income. Defining poverty in terms of income or — in the absence of such data — in terms of expenditure, seems more appropriate and it is this method which is followed in most countries. Of course, it can be supplemented with non-income indicators but without aggregating them into index.
In recent years, there has been a lot of discussion on increasing inequality. It is true that rising inequality has adverse economic and social consequences. The Gini coefficient or other measures of inequality are being used to examine trends in inequality. Income and wealth inequalities are much higher than consumption inequality. According to some estimates, Gini coefficient for consumption is 0.36 in 2011-12 in India. The Gini coefficient for consumption has shown only a small rise over a period of 10 to 12 years. Inequality in income for 2011-12 is high with a Gini coefficient of 0.55 while the Gini coefficient for wealth is 0.74 in 2011-12. Thus, the income Gini is 20 points higher than the consumption Gini, while the wealth Gini is nearly 40 points higher than the consumption Gini in India.
The data base for computing income inequality is not as solid as the base for consumption expenditure. The NSSO surveys have been studied for long and have gone through critical analysis. The reasons for sharp differences between the consumption and income Gini coefficients have to be analysed. In some of the other countries, such differences are no more than 5 to 10 points.
The trends in poverty show that the pace of reduction was much higher in the post-reform period, particularly during the high-growth period. The impact of higher growth on poverty reduction can also be seen from the decile-wise growth in per capita consumption expenditure. A comparison of the growth rate of per capita consumption (in real terms) during the periods 1993-94 to 2004-05 and 2004-05 to 2011-12 shows that the growth rate in the latter period is higher for every decile.
There is no doubt that inequality in itself has several undesirable consequences. It was Simon Kuznets who had argued in a famous paper in 1955 that in the early period of economic growth, distribution of income tends to worsen and that only after reaching a certain level of economic development, an improvement in the distribution of income occurs. It is important to note that measuring reduction in poverty ratio is not the same as measuring inequality. The two can move in opposite directions, particularly in a period of fast growth. That is what has happened in India. The goal certainly should be to lower both. But in the early stages of development, reducing the poverty ratio must be the immediate objective.
The sharp reduction in the poverty ratio and the number of people who are poor happened at a time when the growth rate was very high as shown by the consumption-based poverty and multidimensional indicator poverty. We have concerns about the current behaviour of the poverty ratio in the light of the slowing down of growth recently.
A two-fold approach is needed to ameliorate poverty. First, growth is important. Growth can help to reduce poverty in two ways. As growth occurs, it does affect all sections of the society. However, the extent to which the bottom deciles of the population will benefit will depend upon how fast and inclusive the growth is, and thus, composition of growth also matters. A strong growth also increases the resources available to the public authorities and this will enable them to increase the social sector expenditures. It is, however, obvious that the very fact that the poverty ratio is still high means that growth by itself will not be adequate to reduce poverty. It is necessary to launch specific programmes which work towards directly helping poorer groups and vulnerable sections.
Rangarajan is former chairman of the Economic Advisory Council to the Prime Minister and former governor, RBI. Dev is director and vice chancellor, Indira Gandhi Institute of Development Research, Mumbai
For all the latest Opinion News, download Indian Express App
More From C Rangarajan
Supporting farmers, the middle way
1991’s golden transaction
How deep is India’s poverty?
Under a limited procurement system, government would procure excess farm produce and leave rest to be cleared at market price. For it to work, MSP…
Pledging gold made everyone aware of the enormity of the crisis, and paved the way for economic reforms...
India’s poor are closely bunched up near the poverty line. This could make poverty alleviation more manageable...


No hay comentarios:
Publicar un comentario